Graphing Information Using Excel
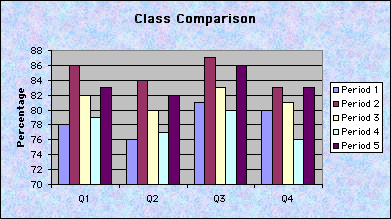
Class Average Comparison
Q1
Q2
Q3
Q4
Period 1
78
76
81
80
Period 2
86
84
87
83
Period 3
82
80
83
81
Period 4
79
77
80
76
Period 5
83
82
86
83
Last Updated on 1/5/00
By KimMarie Pozar Gaye
Table of Contents